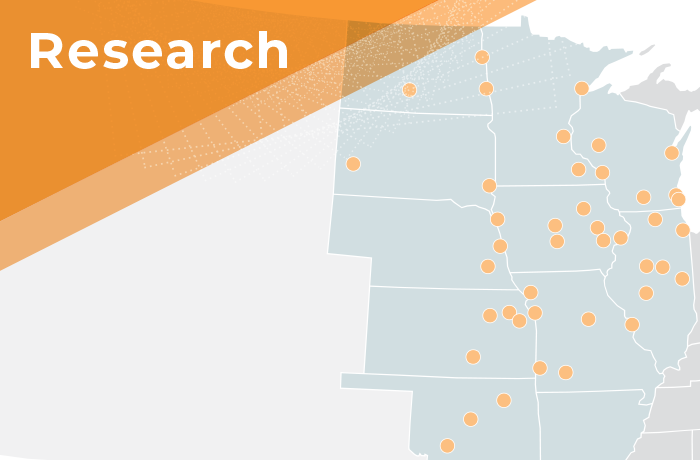
2018 was a terrific year for the Silicon Prairie regarding venture dollars deployed. More than $6.1B was deployed in the region. While the number of companies receiving funds was about 8% lower (approximately 1450 companies were venture backed in the region), the amount of funding was up more than 34.5% from 2017 to 2018. Thus, every state but one (Nebraska) experienced a rise in its average amount of funding per deal.
The most dramatic increases in funding occurred in North Dakota (1338%), Oklahoma (278%), Ohio (135%), and South Dakota (118%). In particular, this increase in Ohio is noteworthy because it moved from $441mm to over $1B in funding. Thus, it did not get the benefit of a small denominator from 2017 – instead, it had true, significant growth that marks a radical increase in actual deals and dollars deployed.
| State | Deals | 2018 Venture Dollars | Actual $ – Expected $ |
| North Dakota | 9 | $24.01 | $3.24 |
| South Dakota | 7 | $21.84 | ($2.27) |
| Nebraska | 30 | $14.33 | ($38.39) |
| Kansas | 32 | $169.03 | $89.46 |
| Arkansas | 42 | $54.77 | ($27.59) |
| Iowa | 51 | $98.86 | $12.61 |
| Oklahoma | 21 | $70.70 | ($37.06) |
| Minnesota | 162 | $772.57 | $438.07 |
| Wisconsin | 139 | $318.65 | ($27.91) |
| Missouri | 127 | $664.96 | $299.75 |
| Indiana | 133 | $224.80 | ($174.12) |
| Michigan | 190 | $719.30 | $35.44 |
| Ohio | 201 | $1,042.05 | $242.33 |
| Illinois | 404 | $1,994.68 | $1,123.01 |
Only Nebraska and Illinois had less money deployed in 2018 than in 2017. In Nebraska, this was stark. The state saw a decline in venture dollars deployed of more than 85% – to a lowly $14.1 million. Illinois saw a slight decline of approximately 1% on venture dollars or about $20 million less on a basis of more than $2 Billion in 2017.
This year, we slightly shifted the tiers of states. We calculated three tiers of expected value to ensure that smaller states were compared only to smaller states. Our shifts were to place Oklahoma in the third tier (the smallest tier) and to move Michigan into tier one, the largest tier. Oklahoma and Michigan are outliers regarding population which is the basis for the tiering structure. However, when we considered two years of data, it appeared that this structure was more equitable to all of the states included. As you can see in the below table, Indiana, Wisconsin, Nebraska, and Michigan are the only underperforming states this year.
| State | 2017 Recalculated Over/Under | 2018 Venture Over/Under | Total 2 year Over/Under |
| North Dakota | ($12.36) | $3.24 | ($9.12) |
| South Dakota | ($5.98) | ($2.27) | ($8.25) |
| Nebraska | $57.23 | ($38.39) | $18.83 |
| Kansas | $38.50 | $89.46 | $127.96 |
| Arkansas | ($23.87) | ($27.59) | ($51.46) |
| Iowa | $0.39 | $12.61 | $13.00 |
| Oklahoma | ($53.90) | ($37.06) | ($90.96) |
| Minnesota | $359.65 | $438.07 | $797.73 |
| Wisconsin | ($136.32) | ($27.91) | ($164.23) |
| Missouri | $24.09 | $299.75 | $323.84 |
| Indiana | ($142.29) | ($174.12) | ($316.40) |
| Michigan | ($151.72) | $35.44 | ($116.28) |
| Ohio | ($270.44) | $242.33 | ($28.11) |
| Illinois | $1,235.22 | $1,123.01 | $2,358.24 |
Because we are nerds, we went back and calculated the states for 2017 in their new tiers and calculated a new over/underperformance for 2017 and for the two years combined. Wisconsin and Indiana continue to trail expectations.
In looking at the data, we have four general findings.
- The Tier 3 States (in italics above) are in a world of relatively small numbers. For example, Iowa which overperformed both years, has only fifty-one deals in 2018. This means that a shift of only a couple of deals would radically affect the data. As we mentioned in last year’s report, Nebraska benefited from this small expectation by having a singularly large deal drive much of the overperformance in 2017. In our opinion, 2018 is slightly lower than is usual in Nebraska, but more in line with the last five years of venture fundings. This year, Kansas benefited from the $100mm funding of C2FO in March 2018. However, in looking at 2019 data, Kansas appears to be in good shape to continue to over-perform as C2FO raised $200mm in July and other companies on the Kansas side of the KC metro have already been funded.
- Overall, the entire region improved and performed significantly better in 2018. Michigan is an outlier because it is caught in between tiers for our analysis. If we had left it in Tier 2, it would have significantly outperformed. So, we would tend to call this an “on expectation” year for Michigan, even though it appears to underperform slightly. However, when excluding Michigan only three states underperformed – Nebraska, Indiana, and Wisconsin. This suggests the entire region had both a strong 2018 and is building a foundation for 2019.
- Illinois, led by Chicago, continues to buoy the entire region with more than 30% of all deals in both years occurring in the State. There are many reasons for this, but the key thing is that the Chicago ecosystem seems to have built momentum and continues to drive economic development in the area. If we were advising communities in the Silicon Prairie regarding their strategy, we would strongly recommend building ties to capital in Chicago and that has invested in Chicago. The number of funders in Illinois is dramatically higher than any other state in the region. Having long, deep connectivity to the region will benefit communities over the long-term.
- Wisconsin and Indiana underperform – but for exactly opposite reasons. Wisconsin underperforms because its largest city, Milwaukee, significantly underperforms expectations regarding venture capital deployed. Madison, the state’s primary college town, is the leading source of venture and deal flow. Conversely, Indianapolis performs as expected (or slightly above), whereas the college towns in Indiana underperform. We noted this last year, and the trend has continued this year.
Earlier in the summer, we published an article on first fundings in the region (HERE). We have attempted to look at three states and how these first funding patterns have affected 2018 rounds. The challenge for many ecosystem builders and observers is contextualizing that most sizable activity today is tied to past first fundings. Thus, first fundings can act as a canary regarding the state of an ecosystem.
What we found was that fundings occurred in fairly regular patterns. Wisconsin had roughly two times the total number of fundings of Iowa and Nebraska. And their first fundings fell into a much more regular pattern. However, our readership includes many states that are more like Nebraska and Iowa. So, we attempted to draw conclusions from the entire set.
| Time Since First Funding | Iowa | Nebraska | Wisconsin | Average |
| 7+ Years | 10% | 10% | 8% | 8.5% |
| 4-6 Years | 13% | 10% | 25% | 20.3% |
| 2-3 Years | 27% | 30% | 21% | 23.1% |
| Previous Year | 8% | 20% | 15% | 13.7% |
| First Funding | 42% | 39% | 31% | 34.4% |
Many states and communities are attempting to grow entrepreneurial ecosystems. However, many misplace their focus on short-term gains. Thus, they miss the fact that a significant portion of today’s results originate from companies that received their first funding in 2014 or before (roughly 30% of all fundings). Moreover, many of these companies that are funded in 2018 are receiving substantially more money in their rounds because of their age and maturity. So, for example, in Nebraska this group includes Flywheel which exited this summer.
From a functional perspective what this means is that if you were attempting to build an ecosystem that produces 100 fundings per year on a consistent basis, a community leader would need to ensure that the area has the capacity to produce significantly more in the short-term to ensure that the long tail of advanced fundings has enough failure and market erratic-ness built in. Basically, by 2018, only a small percentage of companies that were funded for the first time in 2012-2014 were actively seeking money. A significant amount of this was because companies had failed.
However, there was also time-specific challenges in that a company may have just raised a large Series A or B in 2017. This means that the company is now well-capitalized. For example, in Nebraska, Hudl has been a significant outlier regarding fund raising. In years where it does not raise, the state’s total fundraising is significantly less. This is not the sign of good or bad health of an ecosystem. Instead, it illustrates the significant variation that occurs in the amount of dollars in funded companies. And while this is an important metric, it needs to be balanced by the overall strength of the pipeline of potential next round financings.
What this means is that communities first fundings today will affect their fundings into the future. So, long-term relative weakness, as is seen in Nebraska, is likely to create a number of negative years in both number of fundings and amount of fundings. From 2012-2015, the state had 51 first fundings. From 2016-2019(partial), the state has had 23. This is the sign of a community slipping backwards and is revealed by 2018’s weak performance.
States like Wisconsin, that have strong balanced pipes are set to continue but not radically change their current trajectory. Instead, for a state like Iowa or Wisconsin to radically change their current standing – they would need 5-8 years of significant increases in first fundings – not just one. This is a primary mistake made by communities that think a single year or a short burst will create sustained ecosystem growth. Instead, it requires a minimum of five years of development that is significantly above the current status quo.
So, for example, Wisconsin’s largest city Milwaukee has been relatively stable regarding its total deal flow. However, it has consistently stated its desire through various programs and organizations a desire to equal other similarly situated growth communities in the region – Columbus (OH), Nashville (TN), Denver (CO), and Austin (TX). This type of transformation requires a long, sustained effort to fill the top of the funnel. This funnel needs lots of entrepreneurs and startups to get a significant increase in first fundings.
While Milwaukee (or Omaha or Wichita or Fayetteville) has had single year blips, it has not had significant, long-term pipeline bursting early funding changes. For example, in 2015, Milwaukee saw deal flow double in a single year from an average of 32 (from 2012-2014) to 61. This bump is unusual and outstanding. But, as a single year, it is not sustainable and illustrates the erratic-ness of the market.

The tail of the 2015 blip will play out over the next three to five years – likely providing Milwaukee with strong years and significant wealth and economic increases. However, the key to creating explosive growth and sustaining it, is actually to jump, for a sustained period, the number of first financings. How do you do this? You do this with accelerator programs, incubators, prototype grants, and other top of the funnel programs intended to dramatically reshape the long tail of financings over a decade, not just a single year.
In other words, our two reports are intricately linked. First fundings are the canary in the mine and total fundings are a snapshot into how the community’s 5 to 7 year entrepreneurial ecosystem is fairing. Both are revealing, but neither is determinative.
NOTES
—–
To go back and read the first fundings article. Follow this link: https://spnewsnjt.wpengine.com/2019/08/first-fundings-research-paper/.
The State Funding Report was written by Omaha based consulting firm Chapman and Company. The analysis is theirs, but the content being analyzed is from a variety of public sources, including Pitchbook, Form Ds filed at the SEC, and Crunchbase.


